Understanding Key Statistical Concepts in Simple Terms 📊
"Aspiring Data Scientist and AI enthusiast with a strong foundation in full-stack web development. Passionate about leveraging data-driven solutions to solve real-world problems. Skilled in Python, databases, statistics, and exploratory data analysis, with hands-on experience in the MERN stack. Open to opportunities in Data Science, Generative AI, and full-stack development."
What is a Random Variable? 🤔
A random variable is a way to assign numbers to different outcomes of an experiment.
💡 Example: Tossing a coin 🎲
Heads → 1
Tails → 0
Types of Probability Distributions 🎯
Probability distributions tell us how likely different outcomes are. They can be:
1️⃣ Probability Density Function (PDF) – Continuous Data 📈
Used for variables that can take any value in a range.
Normal Distribution (Bell Curve) 🔔
Standard Normal Distribution
Log-Normal Distribution
Chi-Square & F-Distribution
2️⃣ Probability Mass Function (PMF) – Discrete Data 🎲
Used for variables that take specific values.
Bernoulli Distribution ✅❌ (Yes/No)
Binomial Distribution 🔢 (Multiple Yes/No)
Poisson Distribution 📞 (Rare events happening over time)
3️⃣ Uniform Distribution (Equal Chance for All) 🔄
Discrete Uniform Distribution (Rolling a fair die 🎲)
Continuous Uniform Distribution (Random number generator 🔢)
PMF vs. PDF vs. CDF 🤷♂️
| Concept | Type | Use Case | Example |
| PMF | Discrete | Probability of exact values | Rolling a die 🎲 |
| Continuous | Probability over a range | Heights of people 📏 | |
| CDF | Both | Probability of values ≤ x | Cumulative score distribution 🎯 |
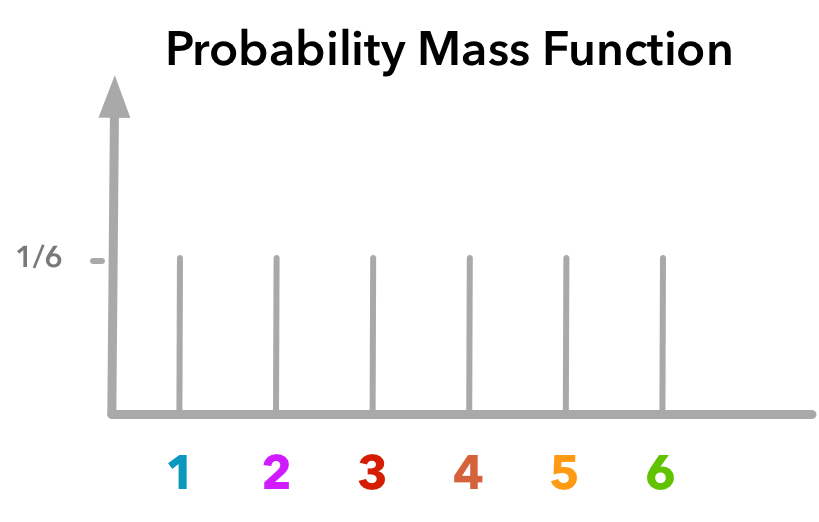
1️⃣ PMF (Probability Mass Function) 🎲
Used for discrete random variables (like rolling a die)
Example: Each face of a fair die has a probability of 1/6.
Graph:
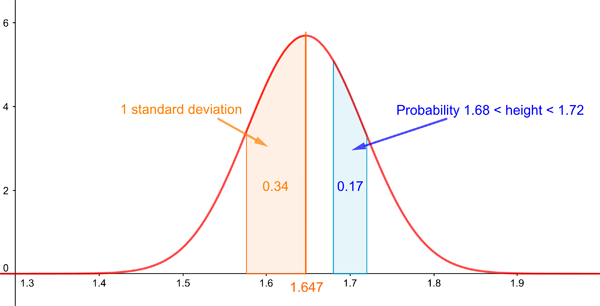
2️⃣ PDF (Probability Density Function) 📈
Used for continuous variables.
Example: Height of people → Bell Curve (Normal Distribution)
Graph:
3️⃣ CDF (Cumulative Distribution Function) 📊
Tells the probability that a value is less than or equal to x.
Example: The probability of rolling ≤ 3 on a die.
Understanding Different Distributions 📚
🎲 Uniform Distribution
Discrete Example: Rolling a fair die → Each number is equally likely.
Continuous Example: A random number generator selecting values between 0 and 1.
Question: If a shop sells between 20-50 items daily, what is the probability of selling between 25 and 40?
✅ Bernoulli Distribution
Definition: Used when there are only two possible outcomes.
Example: Flipping a coin (Heads/Tails).
Mean = p, Variance = p(1-p)
📞 Poisson Distribution
Definition: Used when counting rare events over a fixed time.
Example: Number of calls received per hour in a call center.
Why It Matters: Poisson is useful when counting rare events that happen at a constant rate over time, like the number of customer complaints received daily in a store.
Normal Distribution (Bell Curve) 🔔
Characteristics:
1️⃣ Symmetric around the mean.
2️⃣ Mean = Median = Mode.
3️⃣ No skewness.
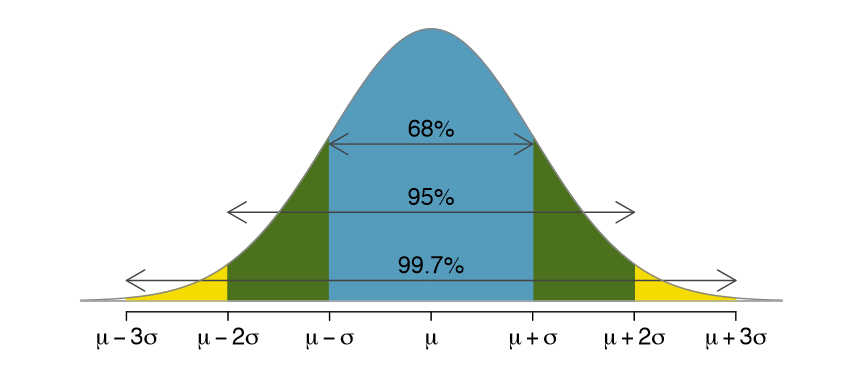
Empirical Rule (68-95-99.7 Rule) 📊
68% of values fall within 1 standard deviation.
95% within 2 standard deviations.
99.7% within 3 standard deviations.
Standard Normal Distribution (SND) ❓
Why use SND when we have Normal Distribution?
SND is a special case of Normal Distribution where mean = 0 and standard deviation = 1.
Use Case: Helps standardize data for comparisons and is essential for ML models like Linear & Logistic Regression.
Central Limit Theorem (CLT) 🧠
What is CLT?
If we take many samples from a population, the average of those samples will form a normal distribution.
Why important? Helps in making predictions & confidence intervals.
Graphical Representation:
🔹 Conditions for CLT:
1️⃣ The sample size should be large.
2️⃣ Sample size ≥ 30.
Real-World Application:
- CLT is widely used in A/B testing, where companies test different versions of a website and analyze user engagement. Since individual user behaviors can vary, taking many samples ensures a normal distribution of results.
Understanding Standard Error 🤓
What is it? It tells us how much the sample mean differs from the population mean.
Why important? Used in confidence intervals & hypothesis testing.
Z-Score Applications 📏
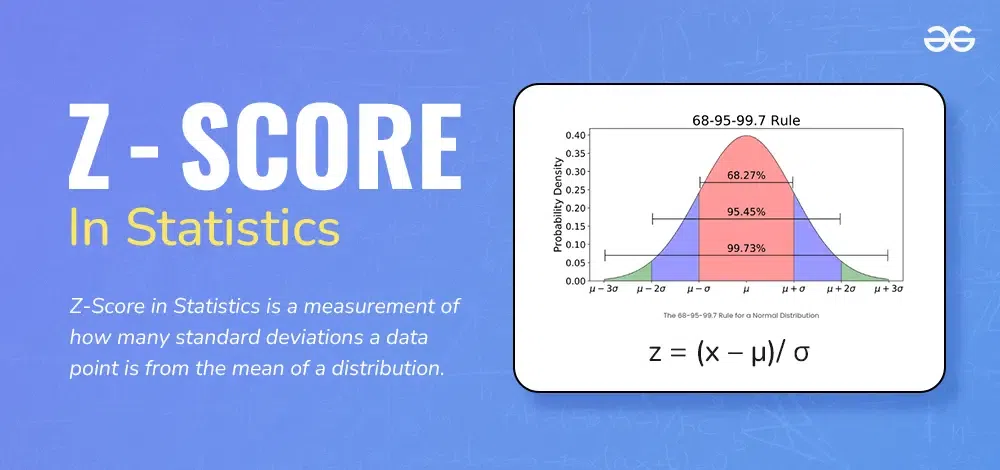
What is a Z-score? It measures how far a value is from the mean.
Example Question: Given marks X = {1,2,3,4,5,6}, mean = 4, SD = 1, find probability that score > 4.5.
Real-World Application:
Credit Scoring: Banks use Z-scores to determine how risky a loan applicant is. If an applicant's credit score is far below the mean, they may be considered high-risk.
Medical Diagnosis: Z-scores are used in bone density tests to identify osteoporosis. A low Z-score indicates weaker bones compared to the average population.
Point Estimate vs. Interval Estimate 🎯
Point Estimate
- Example: Finding the average salary of IT employees.
Interval Estimate
Gives a range instead of a single number.
Example: Predicting an IT employee’s salary will be between $50K and $70K.
🔹 When to use what?
Use Point Estimate when a single number is needed.
Use Interval Estimate when uncertainty is involved.
Final Thoughts 🚀
These statistical concepts are the foundation of data analysis and machine learning. Understanding them will help in making data-driven decisions! 🎯