Mastering Machine Learning: A Beginner’s Guide
"Aspiring Data Scientist and AI enthusiast with a strong foundation in full-stack web development. Passionate about leveraging data-driven solutions to solve real-world problems. Skilled in Python, databases, statistics, and exploratory data analysis, with hands-on experience in the MERN stack. Open to opportunities in Data Science, Generative AI, and full-stack development."
What is Machine Learning (ML)?
Machine Learning (ML) is a branch of Artificial Intelligence (AI) that enables computers to learn from data and make decisions without being explicitly programmed. It helps in automating tasks, recognizing patterns, and making predictions.
Example:
Gmail's spam filter automatically classifies emails as spam or important based on past email interactions.
Why is ML Popular These Days?
ML is gaining popularity due to several advancements:
Advanced Processors: Powerful computing hardware enables complex models to run efficiently.
Data is the Fuel: With the explosion of data, ML models can extract insights that were previously impossible.
Difference Between AI, ML, DL, and DS
| Term | Description | Example |
| Artificial Intelligence (AI) | Broad field aiming to make machines intelligent | Self-driving cars 🚗 |
| Machine Learning (ML) | Subset of AI focused on learning from data | Fraud detection 🔍 |
| Deep Learning (DL) | Subset of ML using neural networks | Face recognition 🤳 |
| Data Science (DS) | Encompasses AI/ML/DL along with data analytics | Business intelligence 📊 |
Types of Machine Learning
1. Supervised Learning
In supervised learning, models are trained on labeled data.
Regression: Predicting continuous values (e.g., House price prediction 🏡)
Classification: Categorizing data (e.g., Spam detection in emails 📧)
2. Unsupervised Learning
Models find hidden patterns in unlabeled data.
Clustering: Grouping similar data points (e.g., Customer segmentation)
Dimensionality Reduction: PCA used in image compression 🖼️
3. Semi-Supervised Learning
Combination of supervised and unsupervised learning.
- Example: Medical image classification where only a small portion of data is labeled 🏥
4. Reinforcement Learning
Concerned with how intelligent agents take actions in an environment to maximize rewards.
Example: Training a robot to walk 🤖 or AlphaGo defeating human champions 🎮
Train, Validate, and Test Data
| Data Type | Analogy |
| Training Data | Teacher explaining concepts 📖 |
| Validation Data | Pre-board exam 📝 |
| Test Data | Final board exam 🎓 |
Model Training and Performance
Overfitting: Model memorizes training data but fails on new data.
Underfitting: Model is too simple to capture patterns.
Generalized Model: Performs well on new data.
| Scenario | Training Accuracy | Test Accuracy | Problem |
| Overfitting | High | Low | Poor generalization |
| Underfitting | Low | Low | Model is too simple |
| Generalized Model | High | High | Best case scenario |
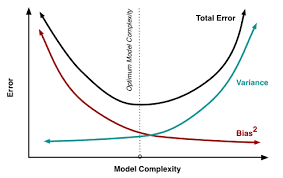
Bias-Variance Tradeoff
Training error (Bias): High bias leads to underfitting.
Testing error (Variance): High variance leads to overfitting.
Handling Missing Data
Types of Missing Data
1️⃣ MCAR (Missing Completely At Random)
👉 Definition: Missing data is independent of both observed and unobserved data. There is no systematic reason for the missing values.
🔹 Example:
A survey was conducted, and some respondents accidentally skipped a question due to a printing error.
A lab machine randomly fails to record some measurements due to occasional power fluctuations.
2️⃣ MAR (Missing At Random)
👉 Definition: The missing data depends on the observed data but not on the missing data itself.
🔹 Example:
In a medical study, older patients tend to skip certain questions about social media usage. The missing values depend on the patient's age (observed data), but not on the social media usage itself (missing data).
In an employee salary dataset, higher-level executives might not disclose their salaries. The missing salary values depend on the "Job Title" column (observed data), but not on salary itself.
3️⃣ MNAR (Missing Not At Random)
👉 Definition: The missing values depend on the value of the missing data itself.
🔹 Example:
In a mental health survey, people with severe anxiety may be more likely to skip answering personal questions. The missing data is related to the actual anxiety level.
In an income dataset, people with very high salaries may refuse to disclose their income. The missing values depend on the income itself, as higher earners are less likely to report their salaries.
Methods to Handle Missing Values
If missing values <1%, drop them.
If missing values >40%, drop the column.
For continuous variables: Use mean/median.
For categorical variables: Use mode.
Use random imputation for extreme cases.
Handling Imbalanced Data
Class Imbalance Solutions
Undersampling (Removing data from the majority class)
Oversampling (Duplicating data from the minority class)
SMOTE (Synthetic Minority Oversampling Technique)
Outlier Handling
Drop Outliers if they are due to errors.
Cap the Outliers (Winsorization).
Replace with mean/median if reasonable.
Feature Extraction 🏗️
Feature extraction transforms raw data into useful features that enhance model performance.
1️⃣ Creating New Features 🔄
Example:
From a date column 🗓️ (
2024-04-02), extract:Day of the week (
Tuesday)Month (
April)Year (
2024)
Example:
From a text column 📜 (
"I love this product!"), extract:Word Count (
4)Sentiment Score (
Positive)
2️⃣ Transforming Existing Features 🔄
Example:
Converting height in cm to height in meters.
Converting log of sales data to reduce skewness.
Scaling Methods
Standardization: Used in ML algorithms.
Normalization (Min-Max Scaling): Converts data between 0 and 1.
Unit Vector Scaling: Ensures data has unit length.
Data Encoding Techniques
1️⃣ One-Hot Encoding (OHE) 🟦🔴🟩
Used for: Nominal (unordered) categorical variables
Example: Suppose we have a
Colorcolumn:
| Color | One-Hot Encoding |
| Red | (1,0,0) |
| Blue | (0,1,0) |
| Green | (0,0,1) |
- Real-World Example: Encoding city names for location-based recommendations 🏙️
2️⃣ Label Encoding 🔢
Used for: Ordinal categorical variables (where order matters)
Example: Suppose we have a
Sizecolumn:
| Size | Label Encoding |
| Small | 0 |
| Medium | 1 |
| Large | 2 |
Why? Because "Large" is greater than "Medium," and "Medium" is greater than "Small."
Real-World Example: Encoding education levels (Primary → 0, Secondary → 1, College → 2 🎓)
3️⃣ Target Guided Encoding 🎯
Used for: Categories are ordered based on target variable correlation
Example: Suppose we are predicting Loan Approval (Yes/No), and we have a
Job Typecolumn:
| Job Type | Loan Approval Rate (%) | Target Guided Encoding |
| Manager | 80% | 3 |
| Engineer | 70% | 2 |
| Clerk | 50% | 1 |
Why? The job type is ranked based on its impact on loan approval rates.
Real-World Example: Encoding customer segments based on purchase likelihood in e-commerce 🛍️Model Evaluation Metrics
Conclusion
Machine Learning is revolutionizing industries by making data-driven predictions. From handling missing data and class imbalances to feature engineering, each step is crucial for building an accurate model.
🚀 Keep exploring, keep learning, and let data guide your decisions!